
When you set out to run a strategic Conversion Rate Optimisation programme, there is a huge amount to consider. But the practises and processes that you lay down from Day 1 will have a major influence on the overall success of the programme. With so many factors at play though, it can be difficult to hold all of the concepts in your mind, and for those of us who think better in pictures, we've drawn together a series of posts that utilise simple graphs to help you structure your programme.
For those of us who have laboured long in the CRO industry, the idea that increasing conversion rates is the core goal of most businesses is a well-known fallacy. For most businesses investing in CRO, the core goal is in fact to maximise revenue, thereby ensuring a strong Return on Investment (ROI) from their CRO spend. This is of course totally logical, and so commonplace is that goal that for most of us, we have to put that sort of thinking at the forefront of our strategic planning.
The Basic Relationship
The calculation of revenue in this context is a simple one:
CONVERSION RATE (CR) × AVERAGE ORDER VALUE (AOV)
But what does that means from a strategic CRO perspective? Firstly, it's important to understand the basic relationship that governs CR & AOV – time for the first graph:

The relationship between the two is one best depicted as a bell curve.
To the far left, there is the absolute maximum possible CR of 100%. But if that were even hypothetically possible, it would likely require an absolute zero cost (i.e. an AOV of £0.00). To the far right, there is the absolute maximum possible AOV of an infinite number of pounds. But again, for that to be possible, the CR would be 0.00% as well – no-one on Earth has an infinite number of pounds after all!
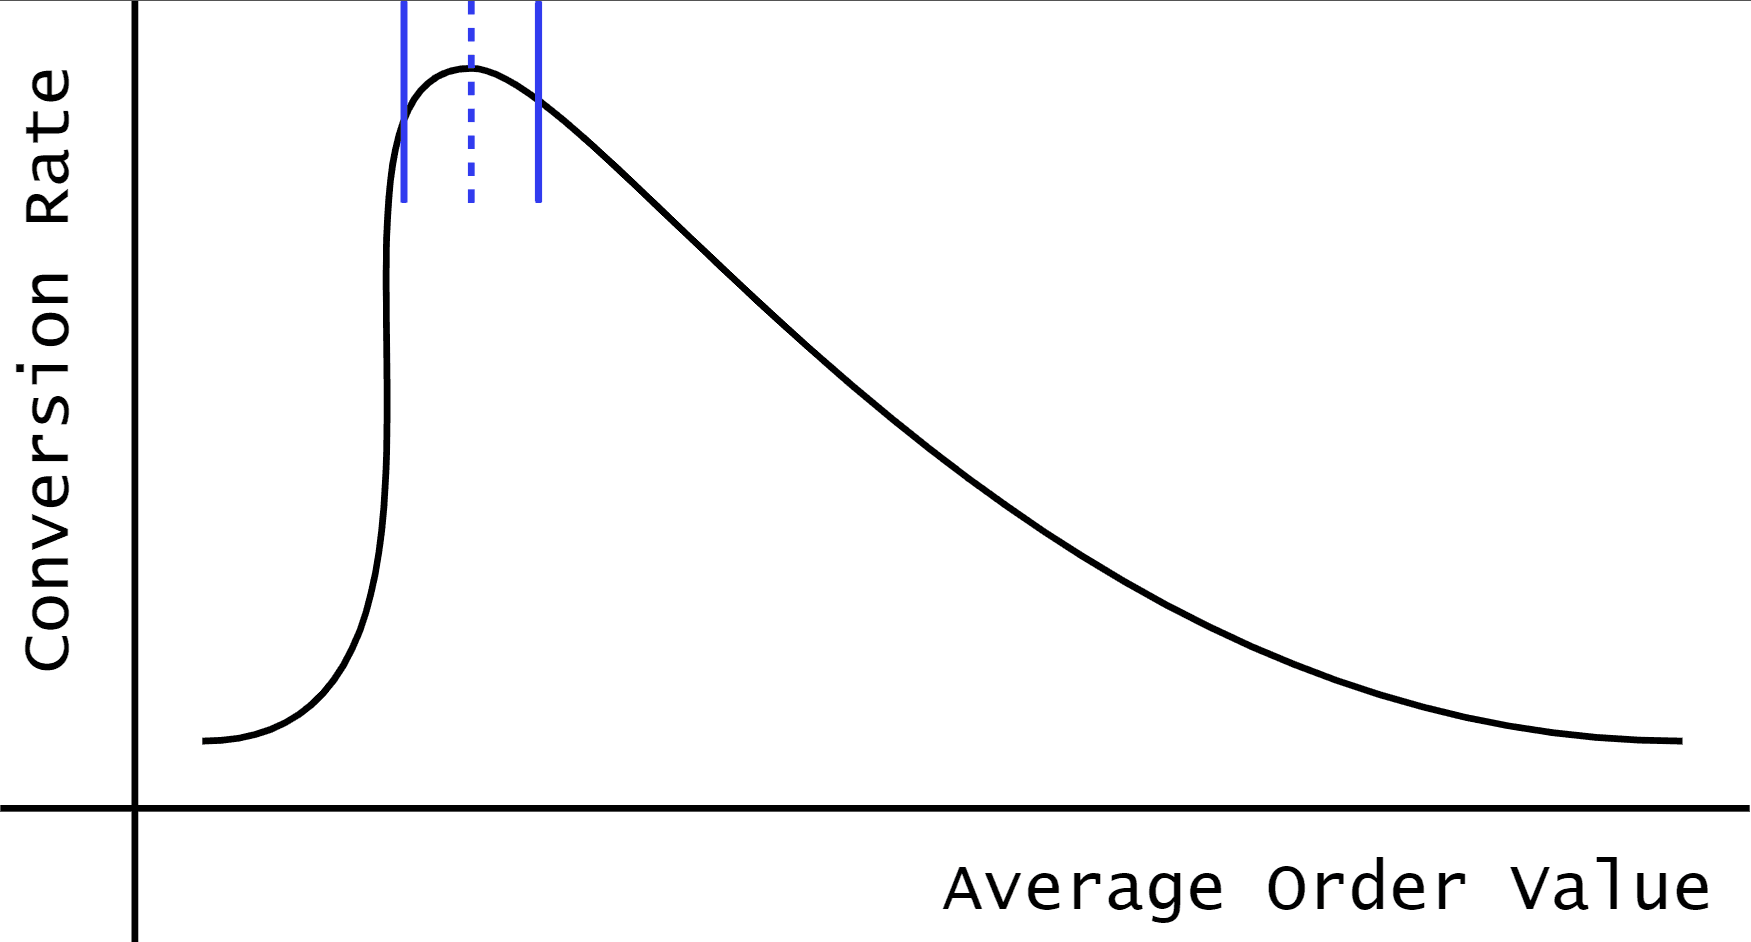
So how does this depiction help us to plan our CRO campaigns more strategically? Well at a basic level, we would look to operate within a small area around the pinnacle of the bell curve:

To be most effective at generating additional revenue, an optimisation programme should be looking to subtly shift the balance between CR & AOV (shown by the full blue lines) to seek out the absolute maximum revenue possible (shown by the dotted blue line).
But of course this is also a simplified view. There are undoubtedly other factors that can come into play when considering how to apply this model to a specific business. And on top of that, thinking more about how this model operates in the real world will help you to apply it more effectively within your own business.
Luxury vs. Budget
The above model assumes that a business is essentially mid-market; in this context, it means that their products and/or services are neither classed as luxury or as budget. They don't compete solely on price, and nor do they require to keep prices high in order to ensure that the relative unavailability of their products continue to give the brand an air of exclusivity.
But depending on the type of brand you are working on, the business drivers are of course substantially different, and this in turn affects the shape of the curve and also the strategies that you are likely to pursue.
Firstly, let's look at the Luxury brand. As mentioned above, brands in this segment have a need to keep their prices high, and therefore the flexibility on reducing AOV in favour of CR tends to be limited. On the flip-side, they generally don't want to increase CR too much, otherwise it starts to impinge on the exclusivity of the product; the very fact that they have visitors coming to the site with no intention/ability to convert is a sign that they have an enviable brand image that visitors aspire to be a part of.
As such, a luxury brand's bell curve may well look more like this:

But what about the other end of the spectrum?
As you might well expect, the Budget brand's bell curve is essentially a mirror image; brands like this tend to make very low profit margins on the products that they sell, and their marketing is all geared towards generating as many sales as possible in order to deliver the necessary profits. As such, driving up AOV will only go so far before the brand starts to lose its everyman image and therefore the focus is generally on pushing CR as much as possible.
Beyond the Test
Now the eagle-eyed amongst you may well have identified some limitations to the above models; whilst they are totally applicable when assessing the needs of individual tests, what happens when you look at longer-term metrics?
These can be notoriously difficult to judge within the confines of an individual test and due to their very nature of being long-term metrics, but with the right strategic planning, they can be built into your CRO programme to ensure that you don't lose sight of the bigger picture.
At the core of our model is the theory that giving up some ground on AOV will improve CR and vice-versa. And a common example of this is to test whether an upsell page in a checkout process has a positive or negative impact on overall sales revenue. Having run tests like these with a wide variety of clients across many industries, the theory almost always bears out – removing those pages will increase CR. It doesn't always (statistically) reduce AOV during the test period, but for the sake of this example, let's assume that it does.
But it is vitally important to remember that AOV is a transaction-specific value, and not a customer-specific value and therefore looking more closely at how your test may have affected the following customer-specific metrics could give you a different perspective on your results.
- The Post-Sale Upsell
If you've sacrificed the upsell of a particular product or products, thereby reducing your AOV to increase your CR, look carefully at any post-sale upsell communications that are then sent to customers. Should these be able to make up the majority of the upsell shortfall, you may have identified those communications as a better means of delivering overall business benefit through Customer Lifetime Value (LTV). - Converter Frequency
As we've seen, focusing visitors on the sale of one product versus pushing multiple products and/or multi-buy purchases will often increase CR but to the detriment of AOV. But the combination of a smoother purchase process and fewer items per transaction may have the added benefit of increasing overall converter frequency, thereby offsetting the AOV. This means that the LTV of a customer, or at least their spend over a set period, may actually increase as they return to the site more frequently to purchase in smaller quantities. - New Customer Acquisition
As a basic rule, visitors with no previous purchase history with your site tend to spend less and are less likely to convert than those who have purchased before. As such, tests that improve CR often have a substantial impact on new customer acquisition, and in turn can give the impression of reducing AOV overall as a greater percentage of sales come from new customers. Monitoring the % of new customer sales in your test can help you to see this, as well as tracking any future sales generated by those customers. This presents a stronger view of how good your new experience is not just in generating new customer sales, but also the propensity of those acquired customers to become repeat customers.
In Summary
Recognising the symbiotic nature of CR and AOV is key to any CRO programme, but particularly when the vast majority are actually looking to achieve Revenue Maximisation. And understanding the likely impact on each side of the equation should help to ensure that your tests are driving in the right direction.

